 AnyTime News

Government cites double-deflation methodology, but the gap between inflation indicators and GDP estimates keeps the economic picture complicated
Pooja Srivastava | Anytime News Network
India’s latest GDP data has opened a fresh debate over how economic growth and inflation are being measured. The government has issued a detailed clarification on the Q1 2026-27 GDP estimates, particularly addressing questions surrounding the -1.5% implicit GVA deflator for manufacturing.
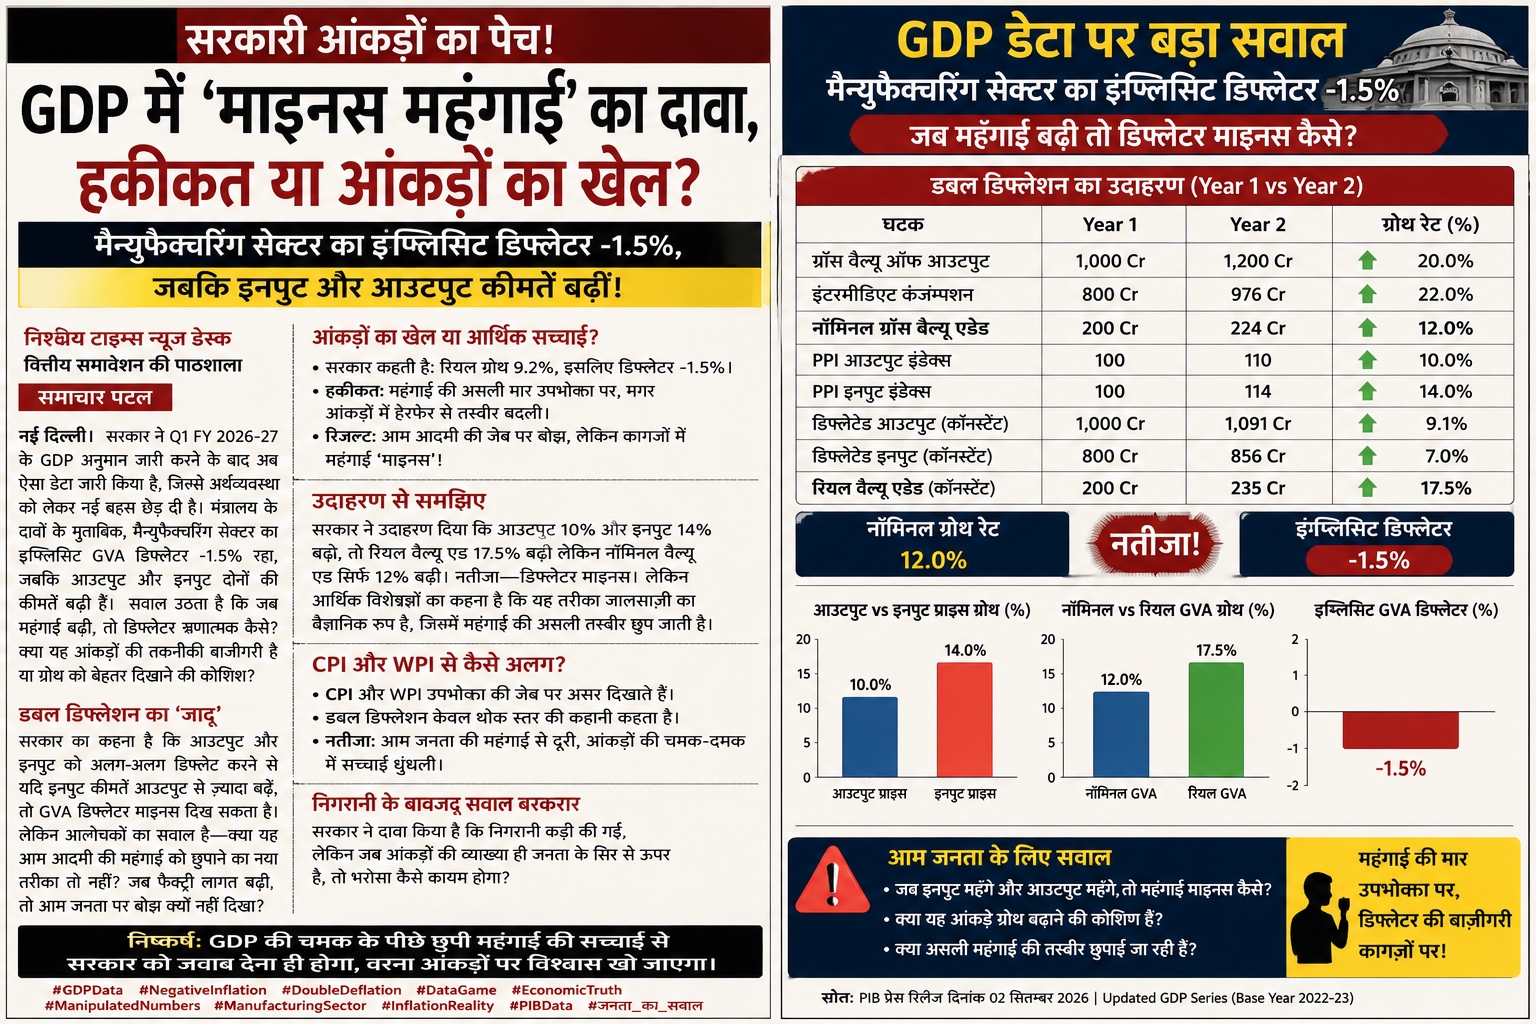
The government insists that a negative manufacturing GVA deflator does not mean that manufactured products became cheaper. Under the new double-deflation methodology, output and intermediate consumption are deflated separately. When input prices rise faster than output prices, the resulting relationship between nominal and real GVA can produce a negative implicit deflator.
But the numbers themselves make the issue difficult for ordinary readers to understand. In the government’s illustration, output prices increased by 10%, while input prices rose by 14%. Nominal GVA increased by 12%, whereas real GVA rose by 17.5%, resulting in a negative implicit GVA deflator.
For Q1 2026-27, manufacturing GVA recorded 9.2% real growth, compared with 7.7% nominal growth. The government attributes the resulting -1.5% deflator to the relative movement of input and output prices under the double-deflation framework.
The ₹86.05 Lakh Crore vs ₹80 Lakh Crore Question
Another major point of discussion is the revision of last year’s current-price GDP. Under the old 2011-12 base-year series, Q1 2025-26 GDP was estimated at ₹86.05 lakh crore. Under the new 2022-23 base-year series, it was first estimated at ₹80.32 lakh crore, later updated to ₹80.44 lakh crore and subsequently revised to ₹80 lakh crore.
The government says these changes resulted from the new base year, improved methodologies, additional data sources and updated indicators—not from an attempt to artificially boost the current year’s growth rate.
Yet the sharp difference has inevitably made the presentation of GDP numbers harder for the public to follow.
GDP Inflation Doesn’t Match CPI or WPI
The government has also addressed the apparent mismatch between the 2.5% implied GDP inflation rate, consumer inflation of 3.9% and wholesale inflation of more than 9%.
Its explanation is that CPI, WPI and the GDP deflator measure different parts of the economy. CPI focuses on household consumption, WPI covers wholesale commodities and manufactured goods, while the GDP deflator covers the wider economy, including investment, government spending, exports and services.
The result is a statistical picture that can look very different from the inflation pressure experienced in individual markets.
Bottom line: The government has provided a technical explanation for the unusual numbers, but the bigger challenge remains communication and transparency. When input prices rise sharply while a key manufacturing deflator turns negative, the data may be statistically explainable—but it is understandable why the figures continue to invite scrutiny.